描述
Graphing Scientific Calculator
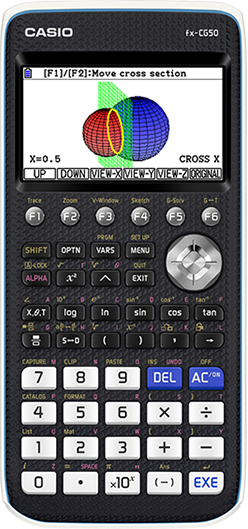
fx-CG50
Easy-to-operate, high-definition 3D Graph provides visual support for mathematical exploration.
fx-CG50 has intuitive operability and exploring features, ideal for mathematics learning.
OS Update Information
Click here to check the latest OS Ver3.40
- Python function is updated.
Features
1 Easy and Intuitive operability
Intuitive operability and G-Solve features make it easy to use the features of fx-CG50.
So you can spend less time teaching how to use graphing calculators (, and more time teaching mathematics).
-
 Interactive format
 -
 G-Solve feature
1Intuitive operation
The user-friendly Icon menu, Function keys and Interactive format enable intuitive operation.
-
 Icon menu
-
 Function keys
-
 Interactive format
Example
- Solve the Polynomial equation.
x2 + 2x + 1 = 0 - The solution is
x = -1
-
 Icon display
-
 Interactive format
-
 Input coefficient
-
 Solution
2 Essential functions for learning all in one
Graphing calculators have a variety of functions covering from primary to higher education. Students can cultivate mathematical thinking through Graph functions operated by themselves.
-
 3D Graph function
1Graphing function
Graph
-
 Linear and Cubic function Graphs
 -
 Inequality Graph
 -
 Parametric Graph
©soupstock – Fotolia.com -
 Polar coordinate graph
3D Graph
-
 CONE
CONE -
 Z=graph
 -
 Parametric graphs
 -
 Rotating body graphs
Learn mathematics more deeply using Explore feature
Students find answers in different ways.
For example, students can use either Graph, Equation, or Matrix function to solve the simultaneous equations below.
Example
- Solve the simultaneous equations.
{ y = xy = -x + 2 - The solution is
x = 1
y = 1
1. Using Graph
-
 Icon display
-
 Input Equations
-
 Draw Graphs
-
 Intersection coordinates
2. Using Equation calculations
-
 Icon display
-
 Select equation
-
 Input coefficient
-
 Solution
3. Using Matrix calculations
-
 Icon display
-
 Input matrix A
-
 Input matrix B
-
 Matrix calculation
Learn 3D Graphs more deeply using Explore feature
It’s difficult to understand 3D graphs used in textbooks.
The 3D Graph feature of the fx-CG50 makes it easy to draw and explore 3D graphs. This feature promotes mathematical understanding of 3D graphs and helps in learning solid figures.
1. Draw and display 3D Graph
3D graphs can be drawn in various ways.
1) Using templates
It’s easy to draw 3D graphs using templates. (*An industry-first feature)
2) Z= graph
3) Parametric graphs
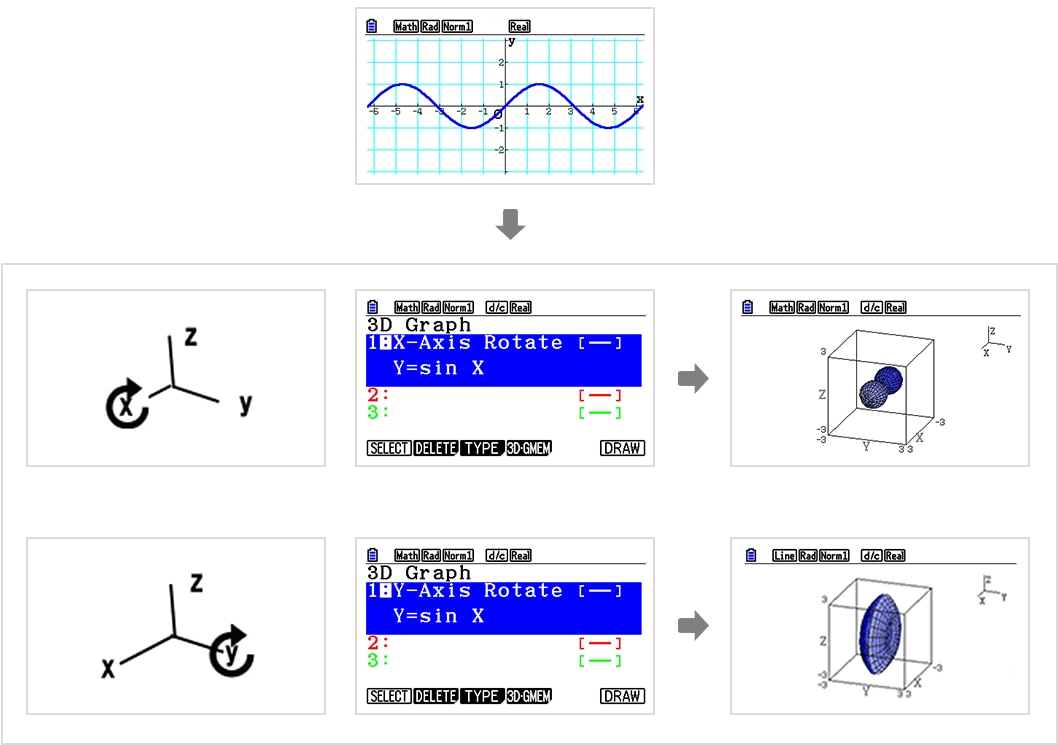
4) Rotating body graphs (① around X-Axis, ② around Y-Axis) *An industry-first feature
Rotating body graphs can be drawn in two ways (rotating around X-Axis or Y-Axis).

2. Draw and display up to three 3D graphs
Recognize combinations of 3D graphs and interactive relationships between two or three graphs mathematically.
-
 Three expressions available
 -
 Cylinder and lane expressions
 -
 Three expressions available
3. Investigate the relationship between expressions and 3D graphs
-
 Expression

-
 3D Graph
Select EXPRESS, VECTOR, or POINTS format when inputting expressions of 3D graphs.
-
 EXPRESS format
 -
 VECTOR format
 -
 POINTS format
4. Explore 3D graphs mathematically
These functions are effective in exploring 3D Graphs geometrically.
1) Viewing from various directions
①Zoom in and zoom out ②Rotation vertically and horizontally ③Cross section ④X-axis, Y-axis, Z-axis view.
These functions are effective in exploring 3D graphs geometrically.
 Cylinder
①
-
 Zoom in
 -
 Zoom out
③
-
 Cross section
②
-
 Vertical rotation
 -
 Horizontal rotation
④
-
 X-axis view
Y-axis view -
 X-axis view
2) Tracing of graphs *An industry-first feature
Explore the coordinates on the surface of 3D graphs (all kinds) by using the cursor keys to move the trace pointer.
3) Intersection between graphs *An industry-first feature
Explore the intersection (coordinates, line) between 3D graphs (line and line, line and plane, plane and plane).
Expression of the intersection line or the coordinates of intersection
4) Relation between graphs *An industry-first feature
Explore the relationship (parallel, orthogonal, etc.) between 3D graphs (line and line, line and plane, plane and plane).
*Based on CASIO information as of August 2017
3D Graph Samples
1. Z= graph
2. Parametric graphs
3. Rotating body graphs
Example 1
Examine intersections between lines, planes and spheres.
Effective learning with 3D Graph
1. Draw and display 3D Graph
Students get the possibility to visualize the most important intersections between lines, planes and spheres: The intersection point, line or circle. This can be very helpful for them to develop solution strategies.
Additionally different input methods are used in all these examples.
Definition by vector, definition by equation.
Definition by vector, definition by equation.
Students can view graphs from various angles, and explore the intersection between 2 objects visually by themselves.
Example 2
Examine the relationship between lines and planes and their intersections.
Teachers and pupils can study the relationship between lines and planes and can examine their intersections.
Intersection : Intersection point, intersection line or Not Found, etc.
Relation : Intersection, Parallel, Orthogonal, or Skewed lines etc.
2Other functions
Scientific calculations
-
Basic function
 Fractions, Square roots Exponents, Logarithms and Trigonometric functions
 -
Algebra
 Complex number calculations and Matrix calculations
 -
Calculus
 Differentiation calculations and Integration calculations
 -
Statistics
-
 Pie Chart
 -
 Med Box
 -
 Linear Regression
 -
 Normal Probability Distribution Graph
Geometry
-
 Apollonius Circle
 -
 Three centers of Triangle
 -
 Triangle and circle
Programming language “Python”
The fx-CG50 comes built-in with Python, a programming language used in the development of Internet search engines, social media sites, robots, etc.
Python conceptual diagram


